
(Save This Thread)
The importance of “alternative thinking” in the markets.

I got a lot of good feedback on my last post.
A guy I know and respect a lot who is doing well for himself in the trad-fi world read it and put me in a category he called "alt thinkers."
It was one of the best compliments I've gotten in a while, and I'm honored to be considered an alternative thinker.
I’ve written about my love of Nirvana before, and their creation of “alternative” rock music is what thankfully brought about the death of corporate rock.

It was bad times…when 1980s hair bands confused many an adolescent boy finding a torn up magazine page on the forest floor. Was it a Playboy or a Rolling Stone? Kevin Curry didn’t seem to care…
Poison absolutely sucked. Guns n’ Roses gets a pass, but just barely. They became super corporate and thank goodness Kurt Cobain superseded Axl Rose in the talent department. After Nirvana, “Corporate Grunge” eventually ruined things. Nickelback songs make me want to Kurt Cobain myself. But there were a few good, pure years between about 1991 and 1998 or so.
And so even if I am merely standing on the shoulders of giants with my thinking, analysis, and writing, if I am considered by anyone as an “alternative thinker” I’ll take that over being a corporate thinker. I’ll wear the badge with honor, and I’ll almost surely never tell anyone to follow a traditional private banking type of asset allocation grid. That’s corporate, lazy thinking.
So in that vein, someone brought this tweet to my attention today.
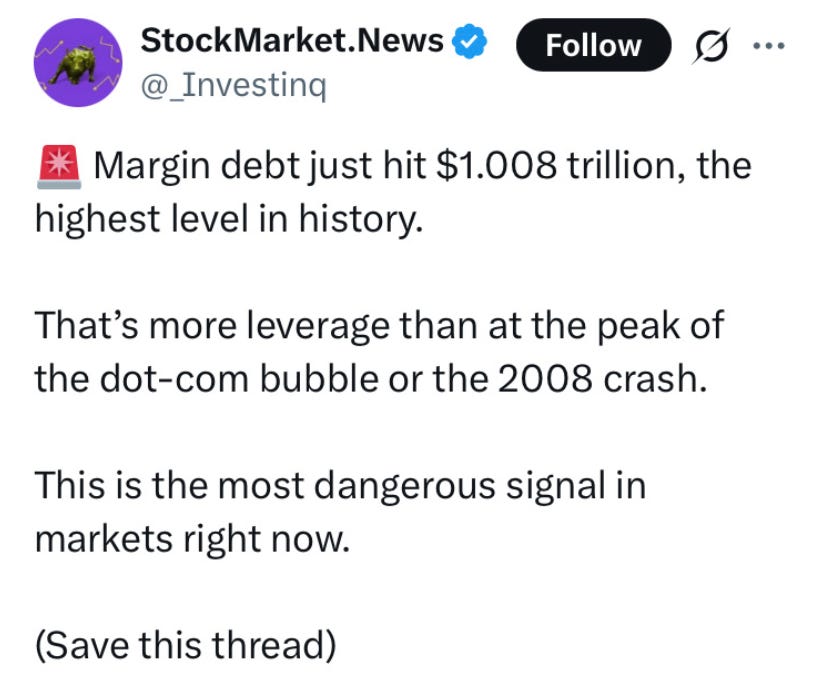
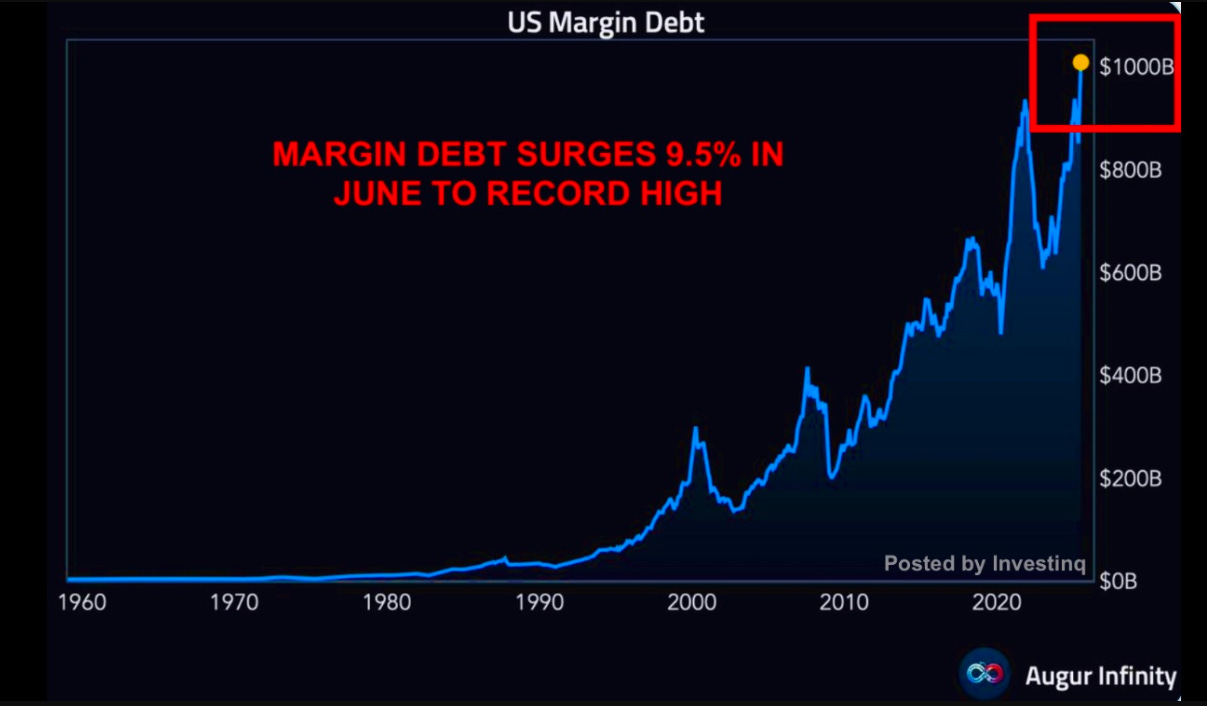
The tweet then had the accompanying picture.
The person who sent it to me was worried and wanted to hear my thoughts on the chart and whether it means that we are in the midst of a crazy debt-induced speculative frenzy.
I was in the middle of researching my next post, but that’s the beauty of writing. When ideas and topics come to you, you can just write things.
So, regarding all the margin debt, I’m not trying to dunk on Augur Infinity here,1 but this tweet displays either some really lazy thinking or an attempt at click bait.
Or both.
Now, margin debt rising is certainly a sign that a lot of speculation is going on right now. But keep a couple things in perspective. The tweet doesn’t take into account the value/purchasing power of the dollar in 2000 and 2008 vs. today.
Think of where CPI was back in 2008. It was 218.69 in July 2008 vs. 321.50 today. That’s a 47% increase since 2008, and so if you adjusted the (approximate) $400 billion in margin debt in 2008 with respect to what dollars get you now, that makes it about $588 billion in 2025 “CPI dollars” (see my crudely drawn red line).
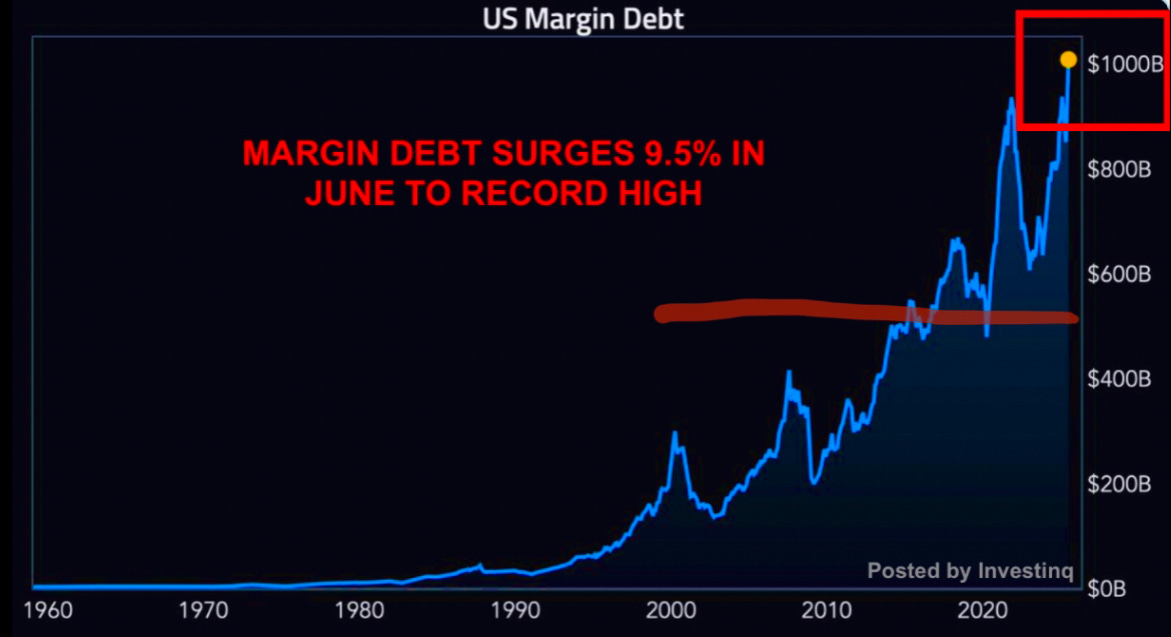
Now, that would still make it a large increase from there to today, but it doesn’t give the same effect as the tweet-poster is looking for. It’s less of a real rise than the nominal chart shows.
And we can also remember that CPI is a complete bullshit statistic that is manipulated with a basket of goods that is designed to tamp down the reported effects of inflation and make sure the government can engage in the financial repression2 of its citizens, inflate debt away, and hand out cost of living adjustments that don’t keep up with the real increase in prices.
I write about that extensively here.
So what’s a good proxy for actual inflation? Well, if you think at all like I and the likely next Federal Reserve Chair Kevin Warsh do, the answer is the money supply.
And what’s a good barometer of what happens when the money supply increases? The performance of the stock market, where a lot of that newly created money flows.
So let’s just look at the S&P 500 back in 2008 in July before the Lehman crash when things really got brutal and a lot of that leverage in the first chart got liquidated.
The S&P 500 closed July 2008 at around 1,267 points. Now it’s close to 6,400 – an increase of about 400%.
So if you took the amount of margin debt then – no need to do anything fancy here – again, just eyeballing the chart it looks like about $400 billion (in 2008 dollars). When you increase that by 400% -- meaning that relative to what it costs to buy the S&P now, the amount of dollars needed in 2025 to take on the same amount of debt and gain the same exposure to “the market” – you get $2 trillion.
So think about what this means. As of now, we are nowhere near as crazy as things were in 2000 or 2008. This rally has been the most boring, most unbelieved-in series of all-time highs that I have ever seen. To date, 2025 is absolutely nothing like pre-crash rallies as far as the insanity of the speculation is concerned.
Along this line of thinking, making educated guesses about the actual inflation in the economy, we could literally double the current amount of margin debt before we are at the “inflation adjusted” level we saw in 2008.
It doesn’t mean that there aren’t any worrying warning signs and that debt and leverage isn’t trending in the wrong direction. But it’s not something that I think we need to be overly concerned about at this time.
I am much more concerned about the value of fiat currencies and how they are like melting ice cubes vs. real assets and stocks (i.e. things governments can’t print out of thin air).
And this is why I write what I write. I don’t think people should use leverage. An old veteran in the business once told me, “If you can’t buy it with cash, you can’t afford it.”
Although, I have also heard old veterans say things like, “Limits are for losers,” and “Stops are for sissies,” so may not everything veterans say is 100% filled with wisdom…
But people will do what they want to do. And for a subset of the investing public that means YOLO-ing into stocks with leverage. I wouldn’t do it myself, and I wouldn’t recommend it to anyone else. But I’m not worried about it – yet.
And if tweets like the one at the beginning of this piece make you worried, you’re probably going to miss out on the raging-est part of the bull market that is probably just starting to enter into full-swing, lurching melt-up mode. There will be severe pull backs and drops. And when they happen, many will question if the end is nigh. The over-leveraged will get stopped out, liquidated, and rekt on both sides. But that’s just a small, controllable fire clearing out the brush and the torn pages of 1980s Playboys (and Rolling Stone) at the bottom of the forest.
A great quote from the book The Sovereign Individual – originally published shortly before the dot.com bubble burst, a work with many prescient observations – said it best.
“Markets always place the greatest pressure on the weakest holders. Indeed, that is part of their virtue. They promote efficiency by removing assets from weak hands.”
So if I could make one recommendation that supersedes all others, it would be to think alternatively, and don’t be a weak hand.
❤️ “Like” and share this post as an alternative to all the the corporate click bait Poison out there.

I would have cut out the name/source of the chart so as not to openly criticize another market commentator – Lord knows, I have been off base and just plain wrong on plenty of things in my day – but I also didn’t want to be accused of stealing someone else’s idea/work, no matter how much I disagree with it, by not citing them. So I’m putting it out there, and I invite Augur Infinity to dunk on me in any way he/she/they so desire(s) if it leads to a good debate and/or dialogue
https://en.wikipedia.org/wiki/Financial_repression